
Hi,
Most people understand standard deviation. If not they at least understand how to derive an average. I have had a few people ask me the definition of standard error. So I suppose there is an impetus to make this post. Posting this on the 1st of April isn’t a jab at the people with the question.
If you want to follow along make a new notebook on Google Colab. Free tier is fine, we’re not going to be building GPT-5000.
https://colab.research.google.com/
Journey to standard error
You can’t understand standard error without standard deviation.
You cannot understand standard deviation without understanding variance.
You cannot understand variance without understanding the arithmetic average.
Let’s start with the average.
If you have five samples, like [10, 20, 30, 40, 50]. What is the number that is the central or a typical value? Now, there are other measures of central tendency but the arithmetic average, sometimes called arithmetic mean is the most popular.
You can calculate it by summing all the numbers and dividing it by the sample size.
numbers = [10,20,30,40,50]
sum(numbers)/len(numbers)
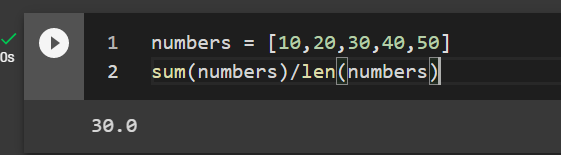
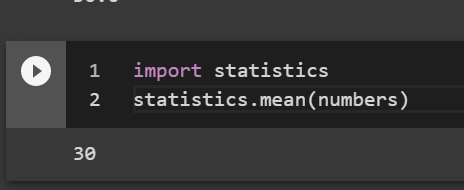
The answer is 30. If you are lazy (smart) you can also use the statistics package in python
import statistics
statistics.mean(numbers)
I prefer to use numpy because it supports linear algebra.
import numpy as np
np.set_printoptions(suppress=True)

numbers = np.array(numbers)
np.mean(numbers) #returns 30
The arithmetic average of [10, 20, 30, 40, 50] is 30. An interesting thing about the average is that it is sensitive to outliers. If we take the same numbers but add 1,000,000 at the end the average will be severely skewed to the right.
numbers = [10,20,30,40,50,1000000]
sum(numbers)/len(numbers)
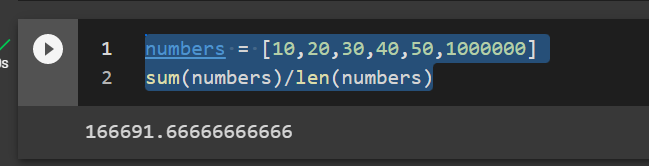
A common example of this effect would be, if a bunch of professionals were sitting in the room with Bill Gates and we wanted to find the average hourly wage for the room. The average of [10,20,30,40,50,1000000] would be $166,691.67 because Bill earns a million dollars an hour.
What is variance?
That average hourly wage which includes Bill Gates in the sample is kind of inaccurate. If you told someone in that meeting, people on average make $166,691.67 then it would be annoying for the people who make $10 to $50 an hour.
A way to look at how the hourly wages vary between samples is by using Variance.
Let’s start with deviations
If you subtract each person’s individual wage from the average it will give you an idea of deviation from the mean.
import numpy as np

numbers = np.array(numbers)
numbers - np.mean(numbers) #subtract the numbers from the average
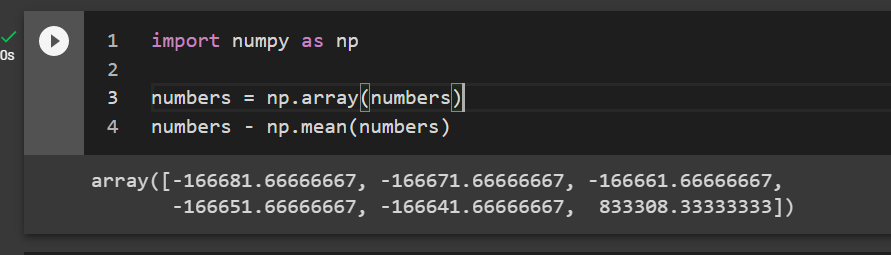
So most people in the meeting deviate from the average by a large amount because there is an outlier in it. Bill Gates makes $833k more than the mean.
Let’s take an average of the deviations by dividing it by the number of samples.
deviation = numbers - np.mean(numbers) #value - mean
np.around(np.sum(deviation)/np.size(deviation),5) #Rounded to 5
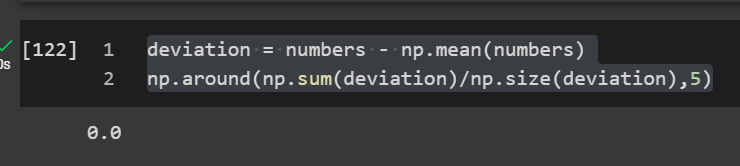
Well, that is kind of annoying. The negative values and the positive values in the numerator cancel out to become a miniscule number if not 0. Dividing by n does not give us an average of the deviations that is meaningful since the numerator sums to 0.
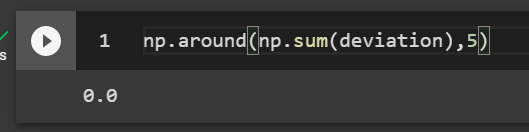
np.around(np.sum(deviation),5)
Variance as an average of squared deviations
However, if we square the numbers then all the numbers would be positive. Just like elementary school, if you multiply a negative number by another negative number the result is a positive number. Thus, we know -2 * -2 = 4, therefore -2 ^ 2 = 4 which is the same as 2 ^ 2 = 4. Squaring numbers gives us a positive number because math.
deviation**2
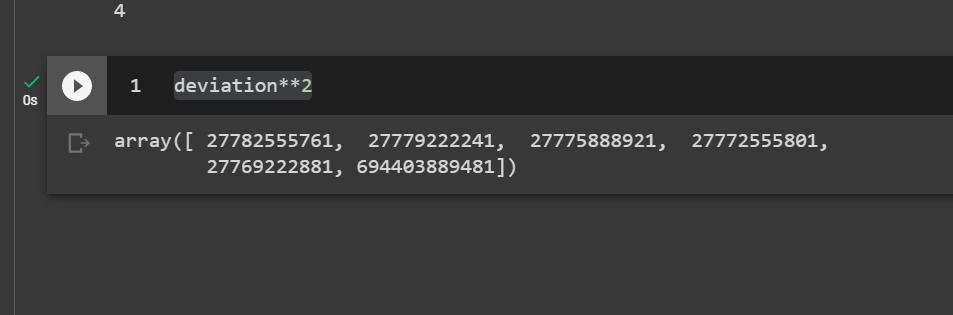
If we take an average of the deviations now, we would have a better idea of the variation since the negatives and the positives won’t cancel out in the numerator.
deviation = numbers - np.mean(numbers)
np.sum((deviation**2)) / (np.size(deviation)-1)
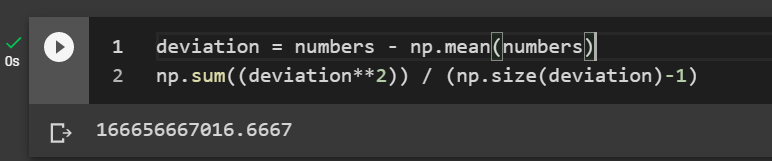
Congratulations, we have the average of the squared deviations. The problem is that the value is hard to interpret. We know it is a large value considering most people make under $1,000,000 an hour. It is such a large value because it is a squared value. This squared value or “squared difference average” is the Variance.
Please note that to take this average of the squared difference, I used n-1 in the denominator. This is called Bessel’s correction. It is supposed to correct some of the bias when calculating the variance and for other “fancy” reasons.
Bessel’s correction penalises small sample sizes too. For example, if you took the variance of just two numbers you would divide by n-1 or 2 – 1 = 1, giving you a large variance and penalising a small sample size. However if you had a dataset of a million numbers you would divide by (1,000,000 – 1) which would be similar to dividing by a 1,000,000. The intuition is that as sample size becomes ridiculously large the population and sample variance becomes equal(er).
Anyway…
What is the standard deviation?
Well the Variance is a large value because we squared everything to get rid of negative numbers. If we take a square root of the variance we will find an average of the deviations that is on the same scale as our original data. This is the standard deviation: simply a square root of the variance.
# Variance without Bessel's correction
variance = np.sum((deviation**2)) / (np.size(deviation))
std = variance**.5 #raising it to .5 is the same as square root
std
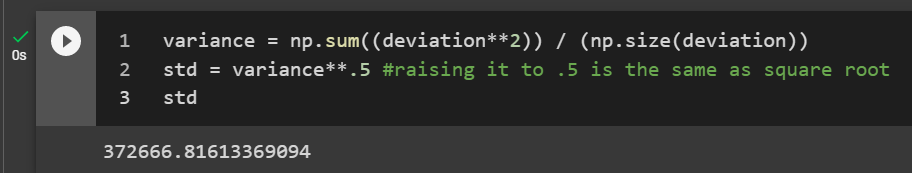
Nice, so the standard deviation is 372,666. This number tells us that the hourly wage varies between +372,666 or -372,666 from the mean. The number ends with 666 because the mean of our dataset is an ungodly amount to be making every hour because of Bill Gates. BTW I know I didn’t round up the variance to $372667.
We had an average of $166,691.66666666666, which was also evil. One standard deviation from the mean would be ($166,692 + $372,666) or ($166,692 – $372,666).
Two standard deviations from the mean would be ($166692 + $372666 + $372666) or ($166692 – $372666 – $372666)
You get it, x standard deviations from the mean would be
mean * (+ or -) std * x.
If you don’t want to do a bunch of manual calculations then you could do all this with 2 lines of python.
numbers = [10,20,30,40,50,1000000]
np.std(numbers)
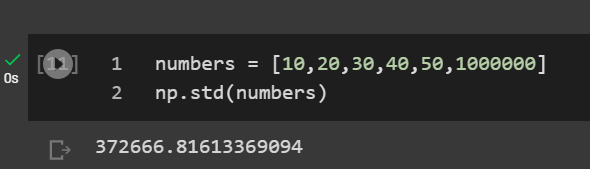
How is the standard deviation helpful? If it is a large number, in this case much bigger than the mean then we know the individual samples must be very different from the mean or have outliers. We know this without even knowing whether it is a Gaussian distribution but just by knowing the mean and the standard deviation.
Note: Like most good researchers, even though it is unlikely you have a Gaussian or Normal distribution, you can always pretend and nobody bats an eye.
What is a standard error?
Well, now we know the variance is an average of the squared deviations. We know the standard deviation is the square root of the variance to bring it to the same scale.
So, what is a standard error? Most people mean the standard error of the mean when they say ‘standard error’. You can have standard errors for other things that aren’t the mean. It is the standard deviation of a statistic from the sampling distribution. Don’t worry if it doesn’t make sense, try to make it to the end.
Instead of telling you the definition of a sampling distribution, let’s begin with a thought experiment. Imagine we had taken an average of the hourly wage not from the one meeting that had Bill in it but several meetings.
- [10,20,30,40,50,1000000]
- [10,20,30,40,50,30]
- [10,20,30,40,50,20]
- [10,20,30,40,50,20]
- [10,20,30,40,50,40]
- [10,20,30,40,50,35]
Cool, so we repeated the survey 5 additional times. What if we took all their means?
my_lists = [
    [10,20,30,40,50,1000000],
    [10,20,30,40,50,30],
    [10,20,30,40,50,20],
    [10,20,30,40,50,20],
    [10,20,30,40,50,40],
    [10,20,30,40,50,35]
]

means = [np.mean(lst) for lst in my_lists]

np.around(means,2)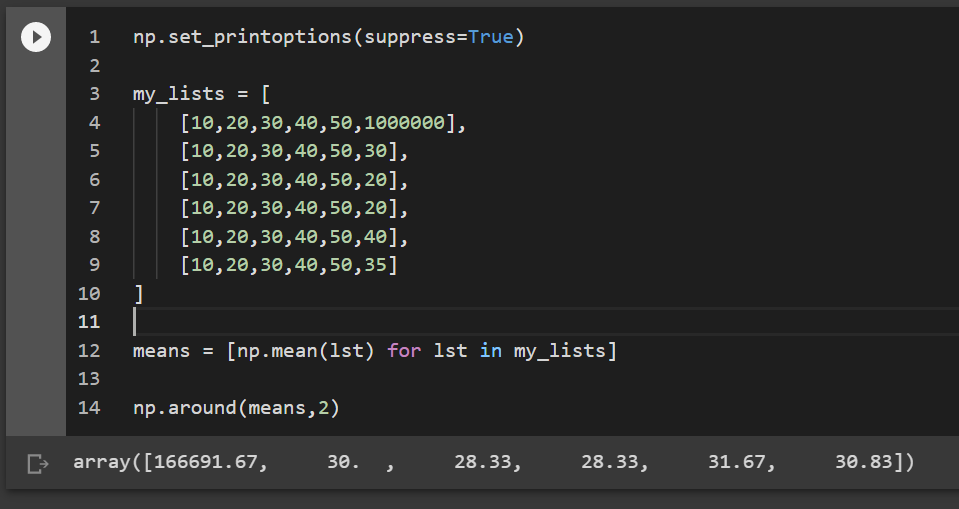
Most of the means from the new datasets are close to 30. [166691.67, 30. , 28.33, 28.33, 31.67, 30.83]. If we collected data several more times and take the standard deviation of those averages, it will become the standard error of the mean. If you take the standard deviation of any statistic from the sampling distribution it is the standard error of that statistic.
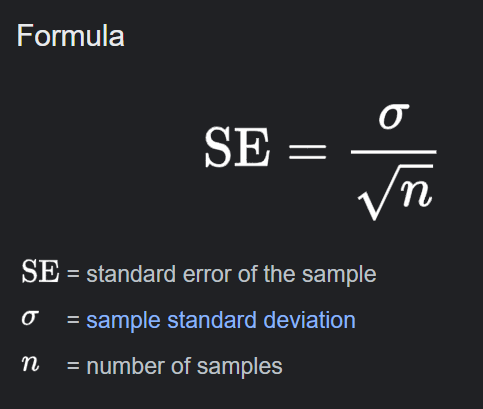
There is a handy formula you can use for the standard error of the mean. Using the formula is easy because conducting surveys is hard. We cannot keep going into meetings and asking people how much they make an hour.
If it wasn’t obvious from above, the sampling distribution is the probability distribution obtained by taking repeated samples from the same population.
If there is a large standard error, it means when you get more samples and take the mean of those samples, it will vary by a large amount. It lets you know how confident you can be about your average.
Here is how you can take the standard error in python:
my_lists = [
    [10,20,30,40,50,1000000],
    [10,20,30,40,50,30],
    [10,20,30,40,50,20],
    [10,20,30,40,50,20],
    [10,20,30,40,50,40],
    [10,20,30,40,50,35]
]

np.std(my_lists) / np.sqrt(np.size(my_lists)) #using the SE formula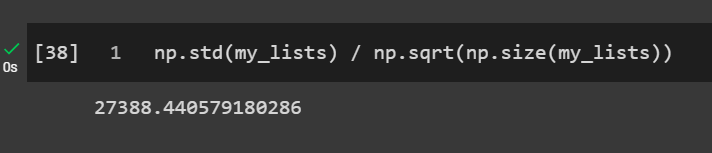
Why do outliers matter? Why does taking a representative sample matter? Take the same dataset and remove the first collection of samples that had Bill G in it.
my_lists = [
    #[10,20,30,40,50,1000000], this is commented out
    [10,20,30,40,50,30],
    [10,20,30,40,50,20],
    [10,20,30,40,50,20],
    [10,20,30,40,50,40],
    [10,20,30,40,50,35]
]

np.std(my_lists) / np.sqrt(np.size(my_lists))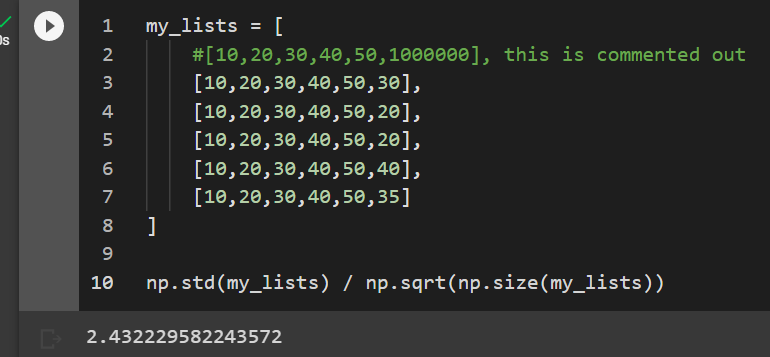
Now the standard error is just 2.4 instead of 27,388. Nothing can make up for a representative sample. If you want to find the average hourly wage of a ‘regular’ person then try to sample from a population of regular people having meetings. Sounds obvious but it’s harder in practice.
Bootstrapping Standard Errors
There is another way of finding the standard error of the mean. It’s by using a resampling method called bootstrap. I argue it is more accurate because we don’t need to know or make assumptions about the population’s distribution.
We can randomly pick a few data points from existing data and calculate their mean. We can do this 100,000 times and come up with a sampling distribution of the mean. If we take the standard deviation of this resampling distribution of the means that will be the standard error of the mean.
We’ll put all the data from the 5 experiments in a big numpy list.
my_lists = [
    [10,20,30,40,50,1000000],
    [10,20,30,40,50,30],
    [10,20,30,40,50,20],
    [10,20,30,40,50,20],
    [10,20,30,40,50,40],
    [10,20,30,40,50,35]
]

bootstrap_data = np.array(my_lists).flatten()
bootstrap_data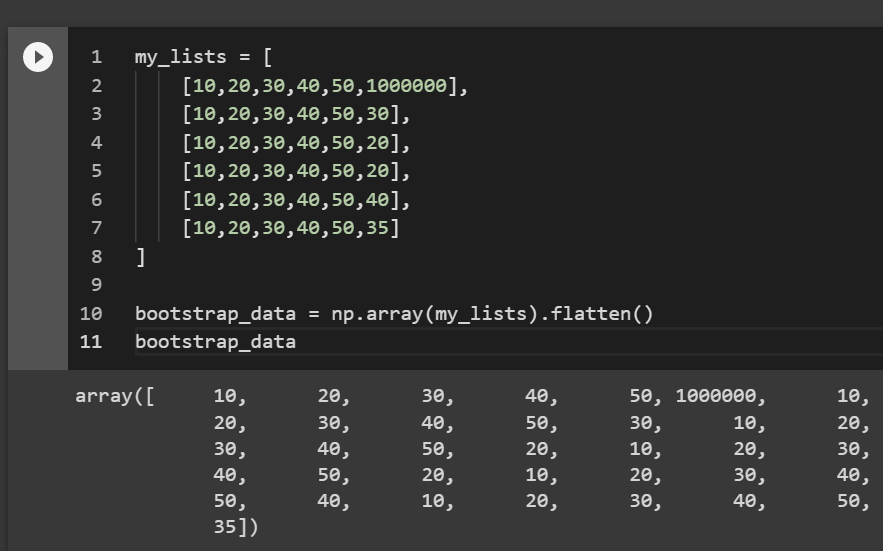
Now we will randomly pick a number from the 36 samples in our dataset. We can do this random selection many times. We’re doing this “with replacement”, which means you can pick the same data point more than once.
Let’s say we’ll randomly pick a number 36 times from the dataset of 36 samples. We can put these 36 randomly picked numbers into a new list and calculate its average. We’ll do this 100,000 times and get 100,000 different averages.
my_lists = [
    [10,20,30,40,50,1000000],
    [10,20,30,40,50,30],
    [10,20,30,40,50,20],
    [10,20,30,40,50,20],
    [10,20,30,40,50,40],
    [10,20,30,40,50,35]
]

bootstrap_data = np.array(my_lists).flatten()

bootstrap_means = []
bootstrap_std = []

for i in range(100000): #do this 100,000 times
  y = np.random.choice(bootstrap_data, size=np.size(my_lists), replace=True, p=None)
  avg = np.mean(y)
  std = np.std(y)
  bootstrap_means.append(avg)
  bootstrap_std.append(std)

print('mean:',np.mean(bootstrap_means),
      'StdError:',np.std(bootstrap_means))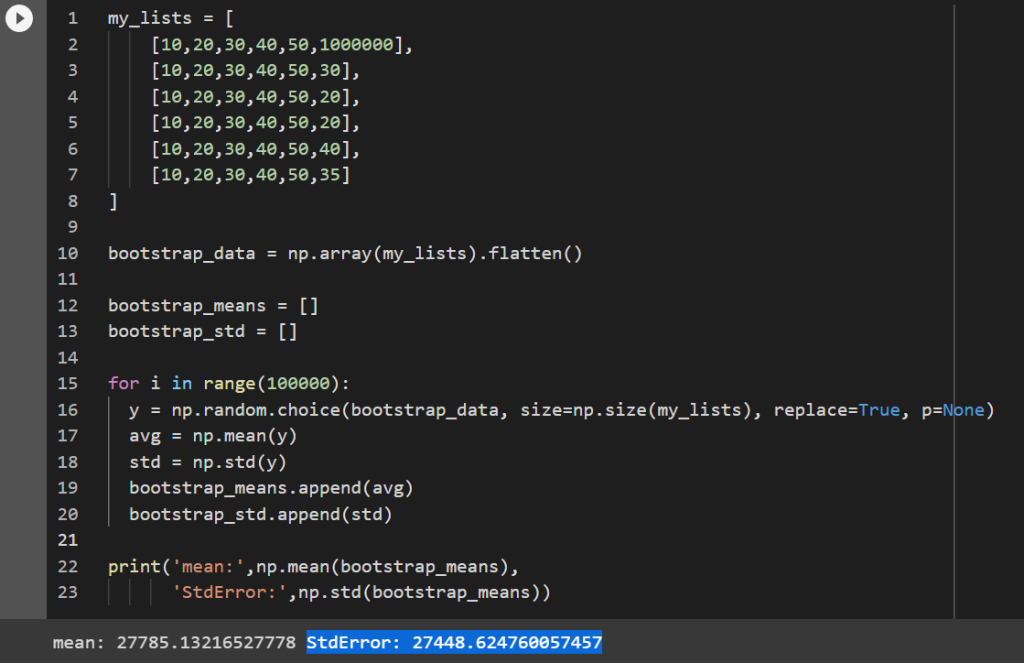
Cool, our standard error of the mean from resampling was 27,448.62 and the standard error from the formula earlier was 27,388.44. With the resampling method you can find the standard error of any statistic, like standard error of the median, standard error of the standard deviation, etc.
This is how you can add the standard error of the median to your code.
my_lists = [
    [10,20,30,40,50,1000000],
    [10,20,30,40,50,30],
    [10,20,30,40,50,20],
    [10,20,30,40,50,20],
    [10,20,30,40,50,40],
    [10,20,30,40,50,35]
]

bootstrap_data = np.array(my_lists).flatten()

bootstrap_means = []
bootstrap_std = []
bootstrap_median = [] #add list to hold the medians

for i in range(100000):
  y = np.random.choice(bootstrap_data, size=np.size(my_lists), replace=True, p=None)
  avg = np.mean(y)
  std = np.std(y)
  median = np.median(y) #calculate the median
  bootstrap_means.append(avg)
  bootstrap_std.append(std)
  bootstrap_median.append(median) #put the median in the list

print('mean:',np.mean(bootstrap_means),
      'StdError:',np.std(bootstrap_means),
      'Std Error Median',np.std(bootstrap_median)) #calcualte std error of the median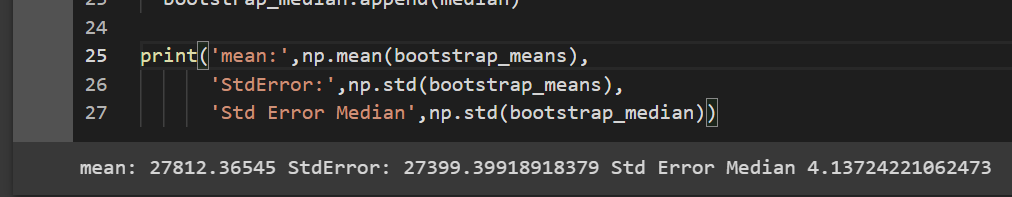
Wow, standard error of the median is 4? It’s because median is a measure of central tendency that is invariant to outliers. It is the 50th percentile or the middle number when you arrange the numbers in order.
If you take the median of the original data with Bill in it, you still get a decent measure of central tendency, unlike when we calculated the average.
numbers = [10,20,30,40,50,1000000]
print(f"Mean: {np.mean(numbers)}",f'Median:{np.median(numbers)}')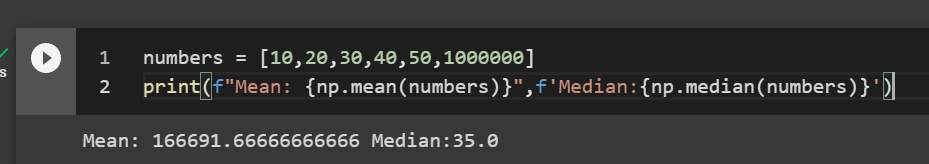
The average is 166k but the median is 35. So pick your measure of central tendency properly. Or you can be like me and calculate both.
Nice work. Congratulations.
What next?
- There are other measures of central tendency, for example, the mode, geometric average and others.
- Resampling methods are cool. You can use them for calculating stats, or tests, or make your dataset synthetically bigger, etc.
- Go forth and experiment.