
EDIT 27/05/2022 : THEY BLOCKED IT, THOSE CAPITALISTS.
Namast
I’ve recently started building a few regime change models and came across Part Time Larry’s YouTube video (in references) for getting recent Fear and Greed Index numbers. They show a way to easily get the data by using CNN’s endpoint.
I believe a lazy quant can make this work even easier.
Fear and Greed Index
So CNN lets you see the chart for historical F&G data. However I wasn’t able to find it. This dude must be a part of an A/B test or something.
The closest thing I found was here: https://money.cnn.com/data/fear-and-greed/
Doesn’t matter, in the video which I highly recommend watching Larry uses the following endpoint. They got it by using the dev console and looking at the API calls for the page.
BASE_URL = "https://production.dataviz.cnn.io/index/fearandgreed/graphdata"
Take a moment to appreciate all the software engineers for their amazing work with the dev console. From finding all the wordle answers to retrieving data by using CNN’s API.
Ethics aside, after this they show fancy ways of making the data usable with multiple packages. I just wanted a data frame so my way only uses two packages and provides a tidy data frame.
Fear and Greed Index Data
You’ll need pandas and requests.
import requests
import pandas as pd
After getting data in JSON format use pandas to clean it up for use.
BASE_URL = "https://production.dataviz.cnn.io/index/fearandgreed/graphdata"
START_DATE = '2021-01-01'

r = requests.get("{}/{}".format(BASE_URL, START_DATE))
data = r.json()
Pandas can read the data, but fixing up the date will need a couple of additional lines of code.
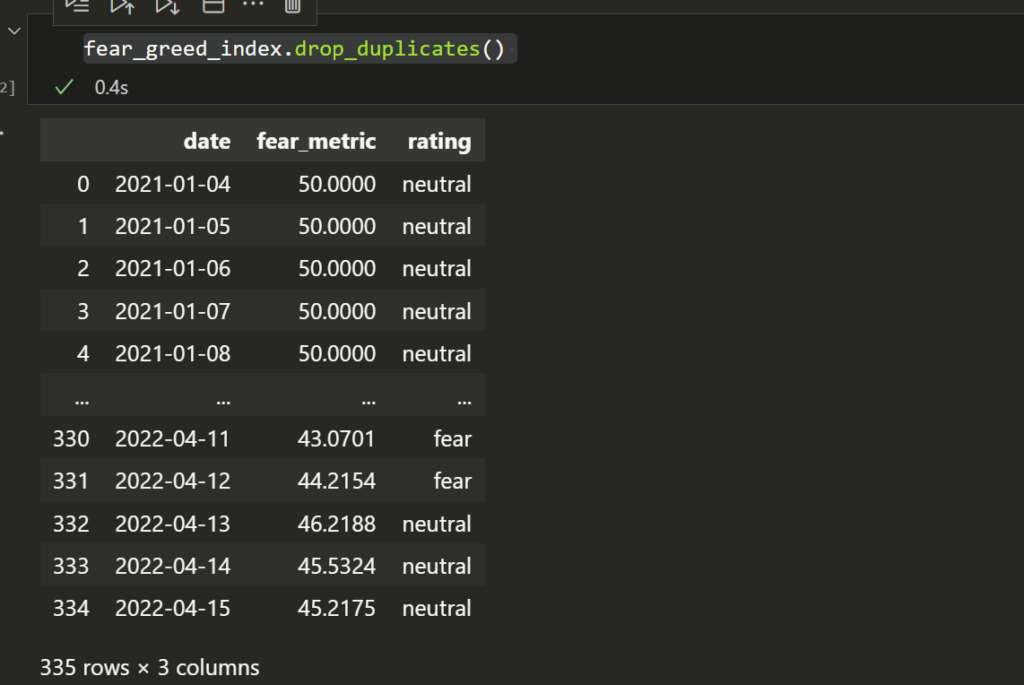
fear_greed_index = pd.DataFrame(data['fear_and_greed_historical']['data'])
fear_greed_index['x'] = pd.to_datetime(fear_greed_index['x']//1000, unit='s').dt.strftime('%Y-%m-%d')
fear_greed_index = fear_greed_index.rename(columns={'x':'date','y':'fear_metric'})
I found it repeats the very last row twice, so I dropped duplicates.
fear_greed_index.drop_duplicates()
If you want it all conveniently packaged here is the function you can use.
import requests
import pandas as pd
BASE_URL = "https://production.dataviz.cnn.io/index/fearandgreed/graphdata"
START_DATE = '2021-01-01'
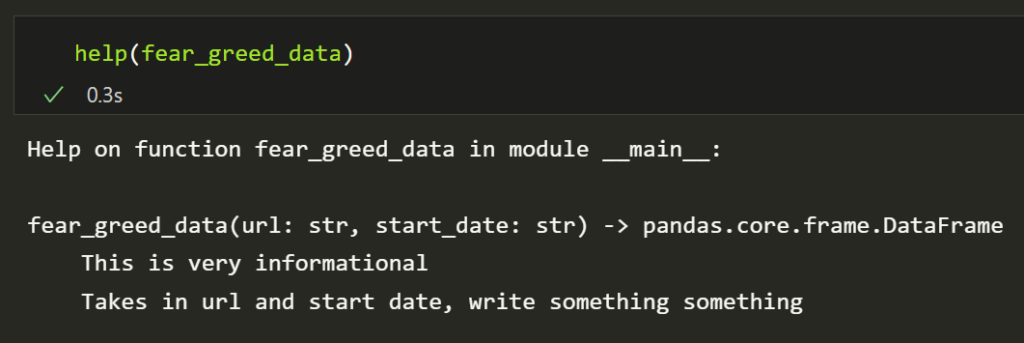
def fear_greed_data(url: str,start_date: str) -> pd.DataFrame :
"""
This is very informational
Takes in url and start date, write something something
"""
_r = requests.get("{}/{}".format(url, start_date))
_data = r.json()
_fear_greed_index = pd.DataFrame(data['fear_and_greed_historical']['data'])
_fear_greed_index['x'] = pd.to_datetime(_fear_greed_index['x']//1000, unit='s').dt.strftime('%Y-%m-%d')
_fear_greed_index = _fear_greed_index.rename(columns={'x':'date','y':'fear_metric'})
_fear_greed_index.index = _fear_greed_index['date']
return _fear_greed_indexYou might want to refactor it, or not. At least change the doc string.
Save it to whatever format if you please.
fear_greed_data(BASE_URL,START_DATE).to_csv('fear_greed_index.csv')Enjoy
References
- https://www.youtube.com/watch?v=6r3Ecf8KkTI
- Larry has a Collab notebook which I wont link with the longer code, give them some views.