
Namaste,
Accounting is the process of identifying, measuring, recording and communicating financial information. If you are not yet asleep then please congratulate yourself. Accountants are reputably boring but they are sticklers for keeping records of a company’s assets, liabilities and owners equity. This is useful for people in finance that want to compare similar companies. I used to enjoy reading financial reports for publicly listed companies if only to see the amount of times ‘digital transformation’ or ‘unprecedented times’ had been mentioned.
Accounting ratios are a good way to compare companies which may have very different values on their financial statements however putting it in terms of per dollar of revenue or some other metric lets us know how a company is doing relative to its peers.
There are many creative accountants and over time people get better at identifying how similar companies might be accounting for similar transactions differently. But, in general accounting practices are enforced by law and follow a convenient standard. Being able to analyse financial statements is another useful skill for everyone.
Where can you find financial statements?
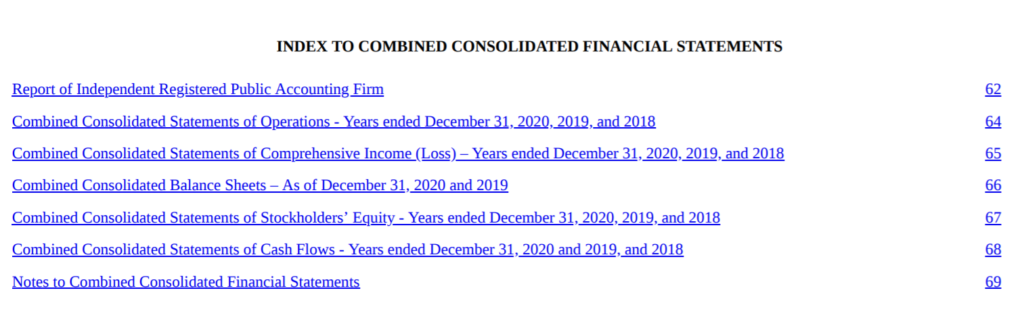
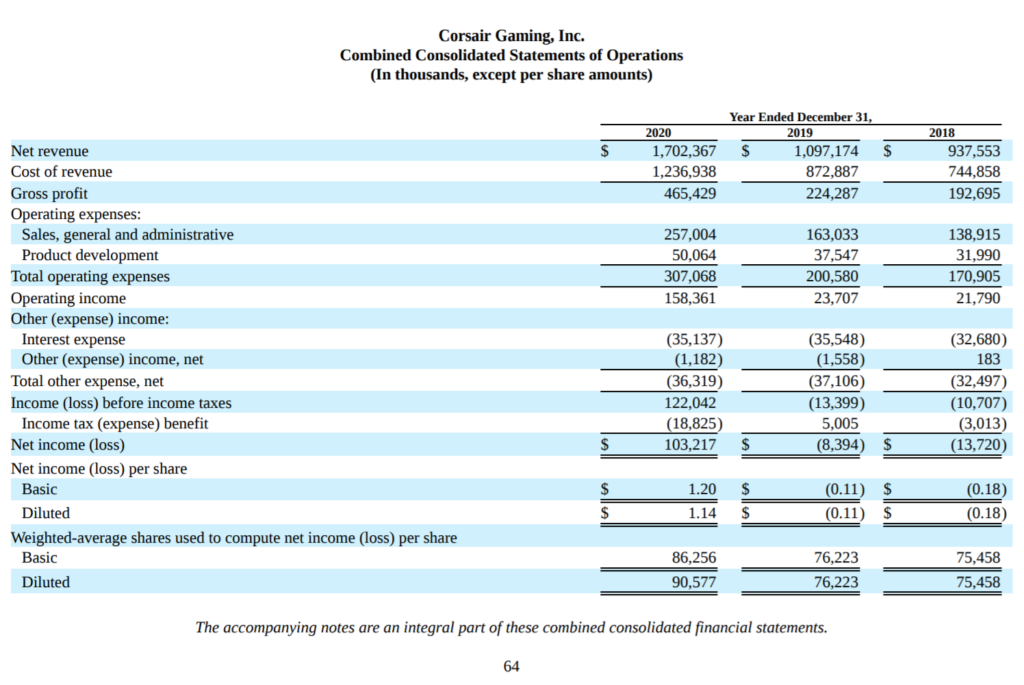
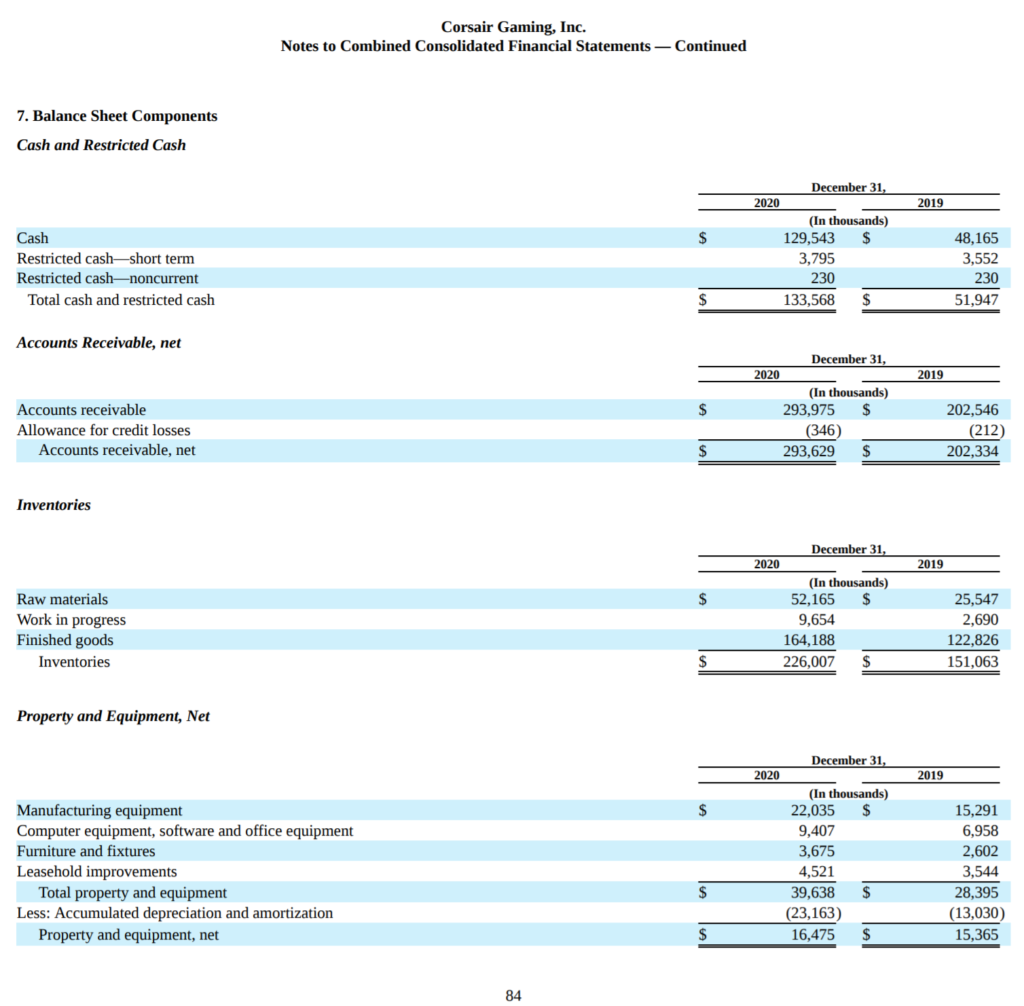
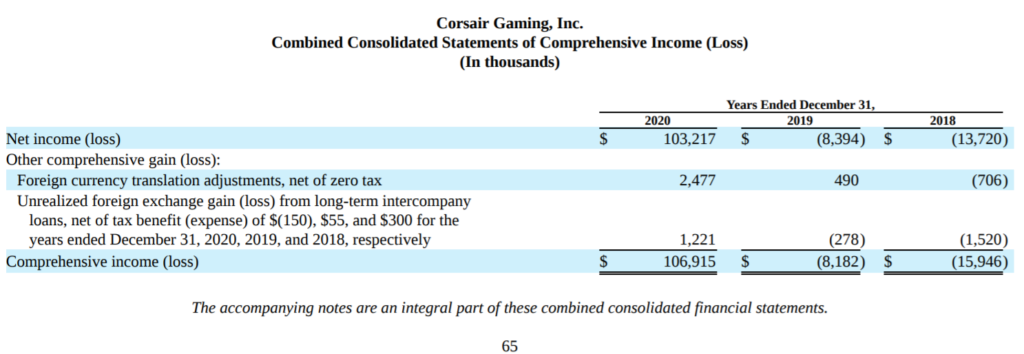
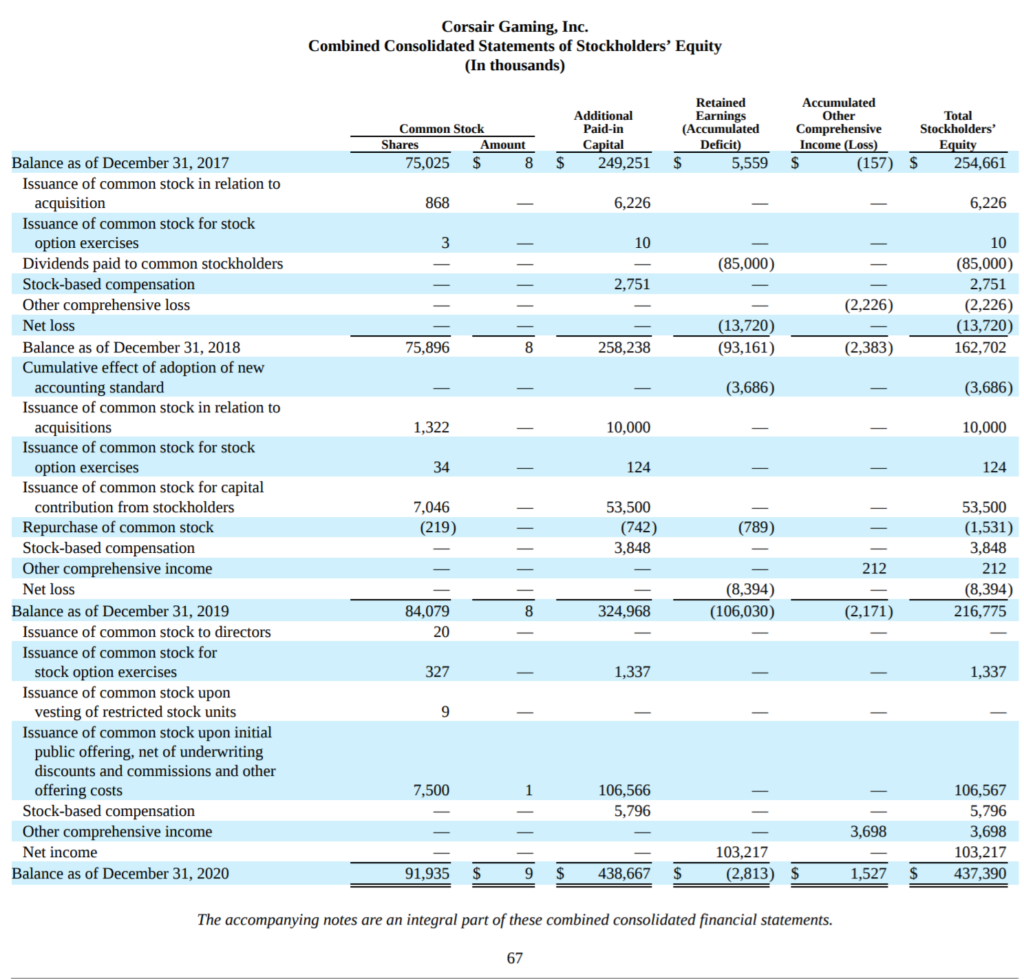
10k filings at the SEC, once you open their file find the place it says Consolidated Financial Statements. Publicly listed companies will have an investor relations page on their website such as here: https://ir.corsair.com/sec-filings/sec-filing/10-k/0001564590-21-012507
Brief introduction to popular accounting
Lets start with with a bit of bookkeeping but without a lot of detail. If you understand these then the ratios make more sense. This will also give you the ability to create your own ratios.
Assets = Liabilities + Owners’ Equity is probably the most important thing to know about accounting. It is what balancing the book means. The difference between assets and liabilities is equity which is what shareholders own. Many people understand this if they have a mortgage. A home is an asset, the mortgage a liability, and the difference is equity.
Accrual accounting, to understand it simply think about how you use any subscription based service. One might pay Netflix $11 for the month. Converting cash which is an asset to prepaid expenses which is another asset, a simple transaction that keeps the books balanced. The next day you don’t really have $11 worth of prepaid expenses, a fortnight after you only have $5.5 worth of subscription. The prior is an oversimplification but the concept can apply to prepaid expenses, revenue received in advance, accrued revenue and accrued expenses which are the most popular adjustments in accrual accounting.
Cash and receivables you can improve cash flow by billing regularly, creating reports and chasing debts. You can defer payments using trade credits, discounts and debt. The time it takes to get paid is a good thing to consider. The operating cycle is the time it takes for businesses to acquire, sell and collect money.
Direct write-off and allowance method for things like bad debt. A direct write-off is simple, when a debt is deemed uncollectible it is written off to bad debt expense and no attempt is made to show the amount which may be recoverable. The allowance method makes an educated guess about uncollectable accounts and shows the true financial position (ideally).
Reporting and analysing non-current assets which is stuff like real-estate, patents, equipment etc. These things don’t get used up over one accounting period. Understanding depreciation, revaluations, impairments and disposal of assets is important. Selling such assets is a one time windfall. If it was an unproductive asset then great, but watch out for things that will reduce a firm’s ability to generate revenue in the future.
Reporting and analysing liabilities which are notes or debt payable, payroll and deductions, revenue received in advance, contingent liabilities and provisions. Most people understand debt and payroll. Provisions are future liabilities for which sacrifice is uncertain like warranty, long service leaves, an increase in salary between recording and payment. Contingent liabilities are future sacrifices that are so uncertain they cannot be recorded thus are only mentioned in the notes section of a financial report. All the juicy stuff might be in the notes.
A note on debt vs equity financing: Depending on the type of business one type may be more desirable because even if a company makes no money they have to pay the same amount of interest. You don’t have to make ‘interest’ payments on equity financing. If a company makes a lot of profit they might have to share it with all equity holders in the form of a dividend. In this instance it may be cheaper to pay interest on a loan rather than selling shares.
Reporting and analysing equity – Retained earnings is the stuff that increases when companies make profits. Dividends are paid out of retained earnings. Value investors care about this since it makes up the book value of a firm.
Cash dividends and share dividends. For cash dividends, on the declaration date retained earnings will be debited and dividends payable is credited. It is the same procedure for shares except the corresponding account is shares payable instead of dividends payable. I only explained this because people get paid out of retained earnings in shares or cash. If you did not understand why stock prices goes down after a dividend then you understand it now; because some of the book value was paid out to stock holders.
Now for the ratios
There are mainly three types of comparisons that use ratios
- Intra-Entity: Within the company, this period vs the past.
- Industry Averages: Within the industry, average debt to equity etc. Useful for internal benchmarking too.
- Inter-Entity: Comparisons with other companies.
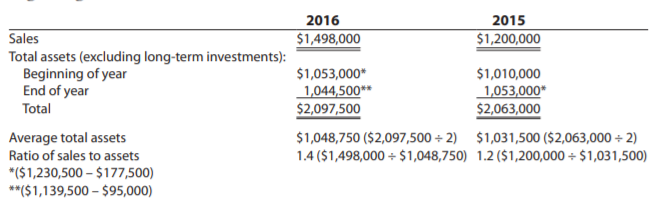
If you see a ratio that uses some kind of average, feel free to pick your own time horizon. It is common to use the beginning of the year number with the end of year number so you can compare an entity with itself over the years. See this image for an example:
Liability oriented ratios, help figure out if firms could go bankrupt
The ability to convert assets to cash is liquidity. The ability to pay debts is solvency. They are interrelated in the sense that even a company with many assets such as factories or inventory can go bankrupt if they cannot pay their debtors in cash.
Current Ratio: If firms have the assets to cover their liabilities
Current Assets / Current Liabilities
Quick Ratio: Overcomes the issue of current assets not being liquid enough. Two companies with the same current ratio might not have the same quick ratio if one has more cash, investments they can sell etc.
(Cash + Temporary Investments + Receivables ) / Current Liabilities
Days in Receivables: Finally all receivables are not the same. Dell might sell someone a laptop with an 8 week period to pay their invoice whereas your cloud computing provider might need you to pay your invoice every week. Companies with the same quick ratio might have very different days in receivables.
(Average Accounts Receivable / (Sales/365))
Operational efficiency ratios, helps figure out if firms are inefficient
Excess inventory actually ties up liquidity. There are also other risks such as the risk of obsolescence or the price of your inventory moving against you. People are getting better by using lean and other operational frameworks. A smart company can pass on the savings from operational efficiency to their customers to improve their brand affinity or keep the savings to improve profit. I’ll leave the second half of this section with ratios that can apply to digital products too.
Inventory Turnover: This varies by the type of inventory, but suitable for intra-entity comparisons and intra-industry comparisons. For example an ice-cream store will have quick turnover while a car dealership might not.
Cost of Revenue / Average Inventory
Days in Inventory: Knowing how many days things sit in a warehouse is useful to understand whether the firm has desirable products or if they overstock.
(Average Inventory / (Cost of Revenue/365))
Employee Efficiency: Calling it efficiency is a stretch, but for digital products there might not really be an inventory. Knowing how much employees earn relative to revenue (can also use profits) is an okay measure.
Revenue / Payroll Expenses
Times Interest Earned: This is kind of in the middle of solvency and operational analysis. Knowing how many times a company has earned what is required to maintain its debt. Gross number is used since interest is paid before taxes.
Gross Income (means before tax) + Interest Expense / Interest Expense
Sales to Assets: Long-term investments are unrelated to everyday operations of a company. This measures how effectively a company uses its assets to sell stuff.
Sales / (Average Total Assets - Long Term Investments)
Return on Assets and Return on Equity: How profitable a company is relative to their assets. Since equity is Assets – Liabilities you can also think of Return on Equity as Return on Net Assets.
Net Income / Total Assets
Net Income / Owners Equity
Profitability ratios, everyone has probably heard of profit margin. ?
Using a bunch of different statements to figure out a company’s ability to earn profits. I don’t think we’ve seen equity and income statements yet.
Earnings Per Share: It has to be reported in the income statement so it is often reported in the media. It means the share of profits that are earned by common stock holders. A lot of tech companies can have a negative EPS since they may not earn a profit.
(Net Income - Preferred Dividends) / Number of Shares Issued
Price-Earnings Ratio: Measures peoples hopes and dreams. Comparing it with other PEs supposedly tells us how people expect the stock to perform. If the PE is higher than the previous quarter or the industry average then people are willing to pay a premium for the shares with expectations of better future performance. Value investors like low PE stocks because they want to buy something underappreciated. It does not mean picking crap products, they too could have low PE.
Market Price of Stock / Earnings Per Share (from above)
X Profit Margin: Ratio of how much money you keep from total revenue.
- Gross Profit is after deducting Cost of Goods Sold
- Operating Income includes deducting operating expenses from Gross Profit
- Net Income is the Operating Income after tax (most deducted)
Gross Profit / Total Revenue
Operating Income / Total Revenue
Net Income / Total Revenue
Finally! We can try model building with DuPont Analysis
Yey! Now that you know a bunch of ratios and hopefully understand how you can create your own. We can move on to combining some ratios or even breaking them down into factors.
DuPont Model is a useful way to decompose the different drivers of Return on Equity (Net Income / Equity). The model gives you the same figure but breaks it down into operational efficiency, profitability and optimal use of leverage. This allows figuring out the strengths and weaknesses of comparable firms.
There are three main ingredients that go into the DuPont Model
- Net Profit Margin = Net Income / Revenue
- Asset Turnover = Revenue / Total Assets
- Equity Multiplier = Total Assets / Equity
Their product gives the value for Return on Equity.
Return on Equity = Net Profit Margin * Asset Turnover * Equity Multiplier
Breaking the model down into understandable chunks
Imagine a company with the following numbers:
Assets = 100
Liabilities = 50
Owners Equity = 50
Revenue = 100
Expenses = 90
Net Income = Revenue – Expenses = 10
Since Assets = Liabilities + Owners Equity
100 = 50 + 50 (balanced af)
We know that Return on Equity is
= Net Income / Equity
= (Net Income / 1) * (1/ Equity)
You can actually use any number instead of 1, the numerator and denominator will cancel out
= (Net Income / 420) * (420 / Equity)
If you use Revenue in both you get this
= (Net Income / Revenue) * (Revenue / Equity)
HOLD UP, we can use the same trick as before,
= (Net Income / Revenue) * (Revenue / 1) * (1 / Shareholders Equity)
Instead of 1 we can use any number! Such as Total Assets
= (Net Income / Revenue) * (Revenue / Total Assets) * (Total Assets / Shareholders Equity)
Using our numbers we can calculate
= (10/100) * (100/100) * (100/50)
= .1 * 1 * 2
= .2 or 20%
This means if we want to improve our RoE we can improve our Net Profit Margin which appears small. Technically we might want to improve the Asset Turnover or Equity Multiplier (leverage) if other companies have similar margins but better metrics otherwise.
Interestingly you can use the process from earlier and break it down into other chucks too. AMAZING!
I might make another post about automating the process with Python and easily comparing the ratios in a future article. If you want to prepare read my other posts on creating a Python environment.
https://freshprinceofstandarderror.com/ai/setting-up-your-data-science-environment/
What you learned
- Accounting is boring but also interesting if you aren’t an accountant
- How to make sense of simple entries in financial reports
- Common ratios are used by aNaLYsTs
- How you can make a model that breaks down RoE
- Finance does not have to be hard
These are things you could do next
- Cash flow statements are amazing, read them
- Notes in financial statements might be as useful as the ratios, read them
Useful reads
https://hbr.org/2016/07/where-financial-reporting-still-falls-short
References:
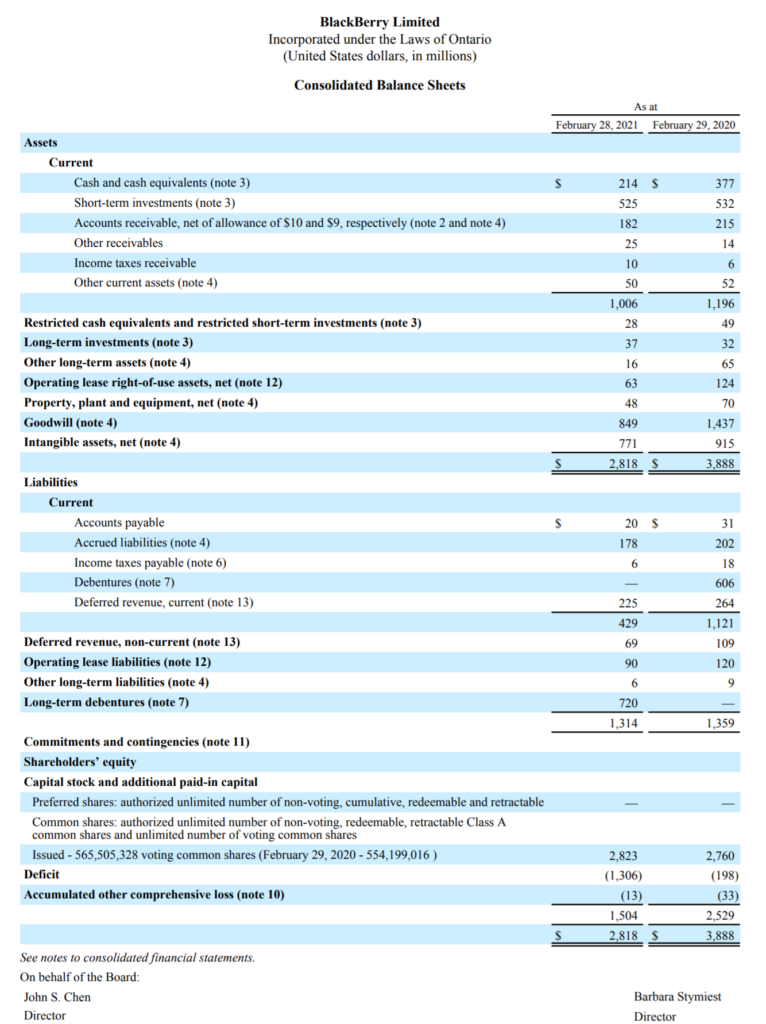
You can use any company to calculate the ratios but the images are from these ones. NASDAQ: CRSR and NYSE: BB