
Hi,
Some people like to watch the world burn. I’m not one of those people. I like to watch it dismantle. That is why we’ll be linear dismantling returns from an expensive ETF or maybe a mutual fund. If a person invests in mutual funds or pays a fund manager a fee, it is the belief of factor investors that they can get those returns for cheaper by considering known factors.
What are factors?
If you are used to seeing things as products it can be hard to change your mindset. Factors are the underlying ingredients whose combination makes the product.
Big Mac = .2 Tomato + .6 Sauce + .8 Buns etc.
There are many factors in finance:
Macro: Such as interest rates and inflation.
Statistical: Correlation is a common one. These factors are implicit in the data, it can be harder to understand the underlying driver.
Style: Which are the most common type of equity factors. Style factors include value vs growth, momentum and low volatility among many others. French and Fama have five factors that apparently describe most market returns.
5 Fama-French factors
These five factors are calculated by taking the difference in average returns between two portfolios. The five factors are:
- Market: The excess returns of the market from the risk-free rate (market – rate)
- Size: Small companies outperform big ones (small – big)
- Growth: Value outperforms growth (value – growth)
- Robust: Operationally profitable businesses outperform ones that lose money (robust – weak)
- Reinvestment: Companies which reinvest in themselves conservatively outperform aggressive companies (conservative – aggressive)
Decomposing factors
Remember Ordinary Least Squares regression? It helps if you do. Otherwise it can still be easy to understand. OLS a way of finding weights or the coefficients for different ‘ingredients’ that make up the product.
vector Y = (coefficient vector B) · (matrix X)
An analytical solution to get the coefficients is pseudo-inverse(X) · Y.
Think of it like this, your portfolio is made up of
y = .2 * Factor1 + .4 * Factor2……..
We can find weights for the factors using OLS regression which provides the equation for a line that goes through the data with the smallest average squared error between each point and the line.
There is an intercept + error term too. The error term is the unexplained ‘noise’ and the intercept is the mean of y when all the coefficients have the value 0. Think of the intercept as the returns that are due to “skill and not luck”, some people call it alpha. In reality it is the returns that are not related to any of the factors you are testing.
CAPM example
Capital Asset Pricing Model is the simplest form of a factor model. Many finance students know of it but don’t understand the relationships.
average portfolio return = beta * average market return
beta = cov(a,b) / var(b) where b is the benchmark
You can see how beta is the coefficient or weight while the excess market return is the factor.
Practical French and Fama decomposition
Hopefully you already have a python environment set up. If not you can set one up by following this article: https://freshprinceofstandarderror.com/ai/setting-up-your-data-science-environment/
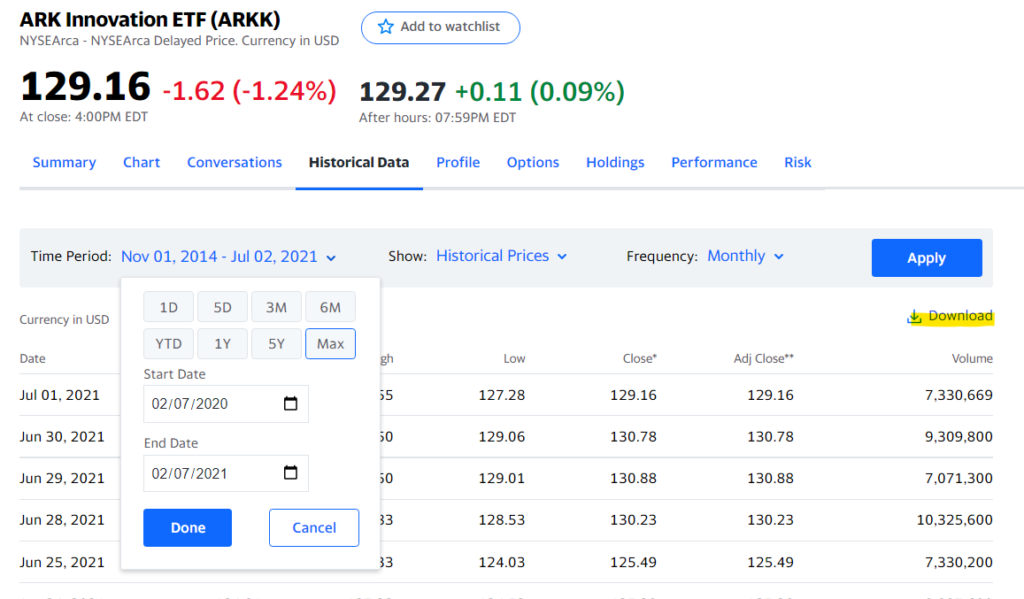
You’ll need a dataset, which can be returns from some ETF. I chose ARKK and got the .csv from Yahoo finance.
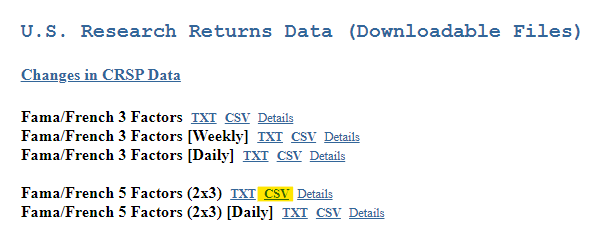
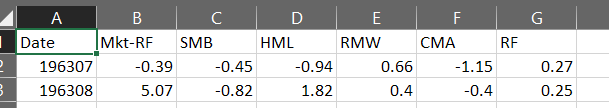
Download the conveniently supplied monthly factors from the French and Fama website. I manually opened the file and got rid of the redundant headers and the yearly information at the bottom. Maybe rename the first column as ‘Date’ to save yourself time later.
Using pandas and the usual suspects for factor analysis
Once you have the files we can begin loading and cleaning the data.
import pandas as pd
import numpy as np
import statsmodels.api as sm
ff_factors = pd.read_csv('F-F_Research_Data_5_Factors_2x3.csv')
arkk = pd.read_csv('ARKK.csv')We loaded the data but the French and Fama dataset is odd. The returns are in percentages and the date column is wonky. If we convert the column to datetime and shift the data by 1 month it’ll correctly match the ARKK date index. I had verified this using daily data and resampling the returns.
We also need to convert the ARKK data from dollar values into percentage returns.
ff_factors.index = pd.to_datetime(ff_factors.index,format='%Y%m')
ff_factors = ff_factors.index = pd.to_datetime(ff_factors.index,format='%Y%m')
ff_factors = (ff_factors / 100).shift().dropna()

arkk_df = arkk[['Adj Close']].pct_change().dropna()
The ARKK fund did not exist in 1963. Similarly, we don’t have the French and Fama factor returns for recent months. We will use the starting date for ARKK and the ending date for F&F data to slice the dataframes.
factor_arkk = ff_factors[ff.index[0].date():].copy()
factor_arkk['arkk'] = arkk_df[:ff.index[-1].date()]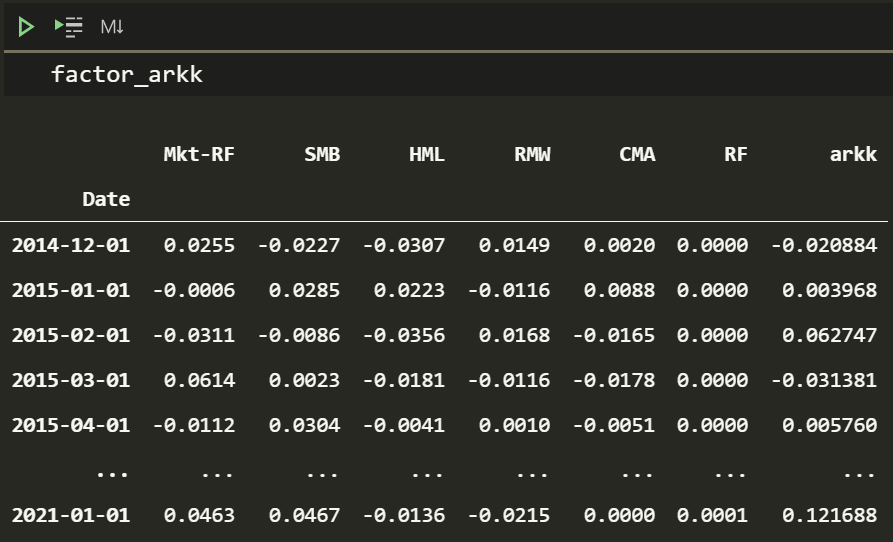
Nice work!
Running the regression ?
import statsmodels.api as sm
ff = sm.add_constant(factor_arkk[factor_arkk.columns.difference(['arkk'])])
rp = factor_arkk['arkk']
lr = sm.OLS(rp, ff).fit()
print(lr.summary())

#Alpha
print('\n\n\nALPHA')
round(((1+lr.params[0]) ** 12) -1,4) * 100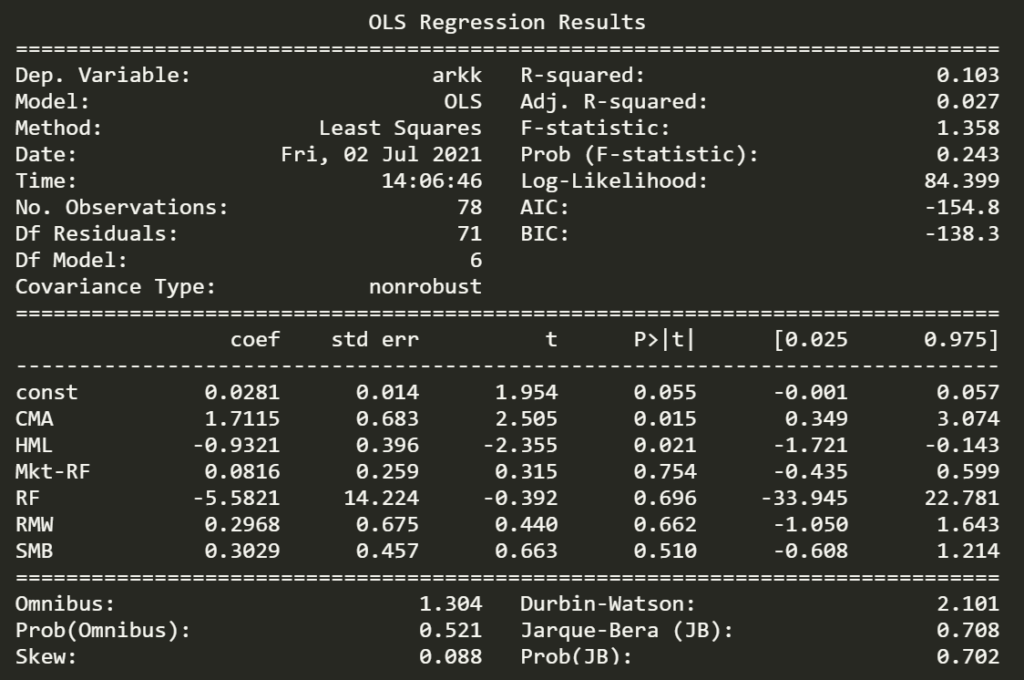
OMG! Cathie is a genius. If you notice, the monthly intercept can be converted to an annual figure. Did you see that alpha? 39.45% ?
That analytical solution to solve the least square coefficients from earlier will still give you the same weights if you understand linear algebra (well, even if you don’t understand linear algebra). This is called one-shot learning in Machine Learning.
np.dot(np.linalg.pinv(ff),rp)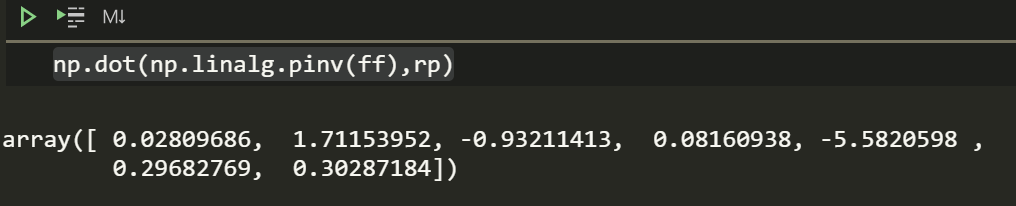
The r-squared is horrible which states that this model explains 1/10th of the variance. It can be tempting to assume ARKK returns aren’t too related to the factors. However, that isn’t the right conclusion to draw since it is likely that ARKK relates to other factors like momentum which are not a part of Fama and French factors.
The statistical package provides the values of hypothesis tests for the weights which is convenient. Looking at the statistically significant coefficients is useful. The HML is quite negative which means ARKK is more growth than value. I know NASDAQ too is more growth than value. Perhaps returns from NASDAQ can be used to explain ARKK returns.
You can either get NASDAQ composite returns from Yahoo finance or use a library to pull the data.
from datetime import date , timedelta
import yfinance as yf

start = factor_arkk.index[0].date()
end = factor_arkk.index[-1].date()
ndq = round(yf.download("^IXIC", start=start-timedelta(days=30), end=end+timedelta(days=5), interval = "1mo")['Adj Close'].pct_change(),4)
factor_arkk['NSDQ'] = ndq
I bet ARKK is pretty correlated to NASDAQ.
factor_arkk.corr('spearman')['arkk']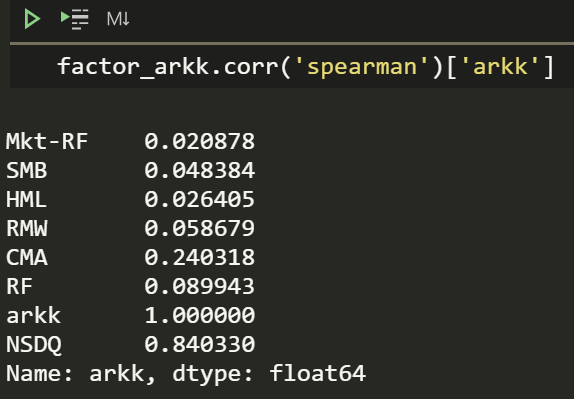
Yup, lets see if the regression weights are significant.
ff = sm.add_constant(factor_arkk[['NSDQ']])
rp = factor_arkk['arkk']
lr = sm.OLS(rp, ff).fit()
print(lr.summary())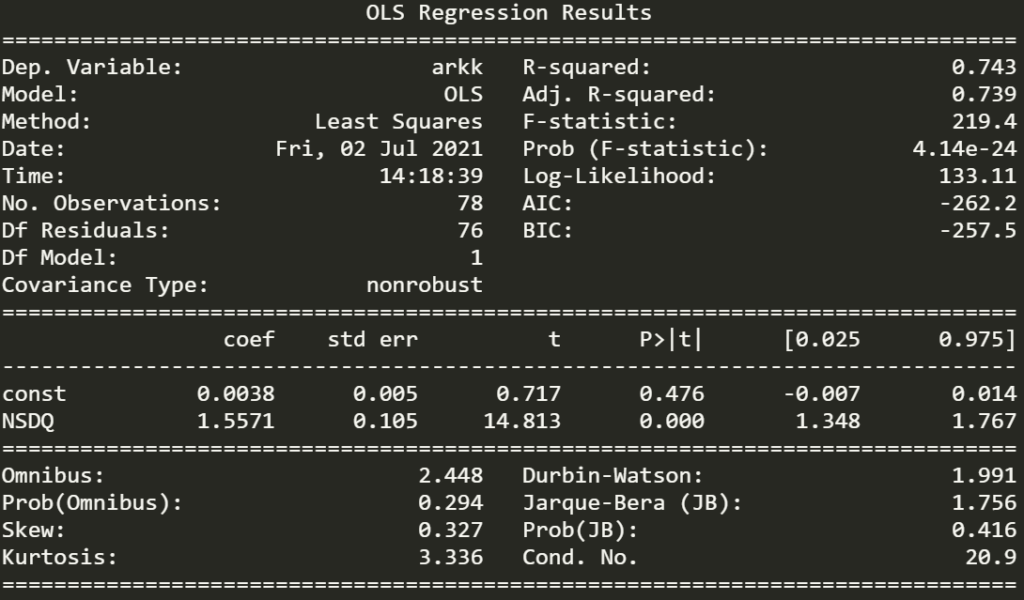
The r-squared is quite high and the p-value for NSDQ is statistically significant. Since the coefficient is a large value of 1.56 and NASDAQ has provided high returns since 2014 this means that ARKK should have ridiculous returns. This also means a person could try to get ARKK returns with leveraged NSDQ.
(1+factor_arkk).prod()-1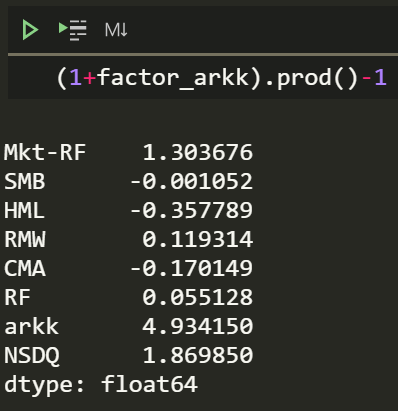
That is almost 493% since inception. I wonder how the volatility compares.
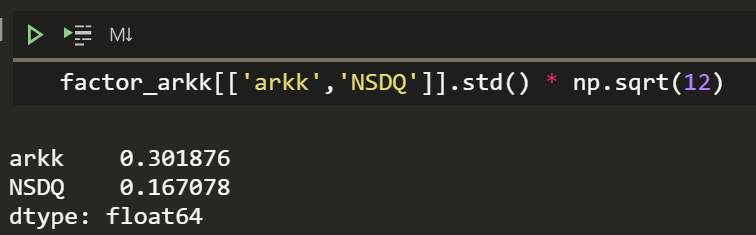
Okay, so it’s almost twice as volatile. Which is interesting, having higher returns with higher volatility is less impressive.
factor_arkk[['arkk','NSDQ']].mean() / factor_arkk[['arkk','NSDQ']].std()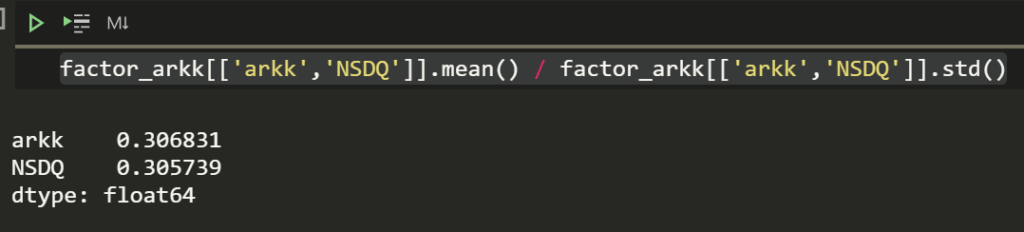
Aww, returns per volatility are similar. You can try geometric averages or whatever other average you want too.
ARKK does have a tiny alpha though. IDK if having many analysts justifies the meagre and likely spurious alpha but there are other funds out there that are worse than the market on risk adjusted metrics.
In saying all that it is nice to remember that Ark try to be innovative and Catherine Wood is a role model for many. I am glad that she exists and is someone to look up to as a strong woman in a male dominated field.
What you learned
- Style factors exist in investments, there are many which were not covered here.
- How to use regression and that OLS has a simple analytical solution too. It is still recommended to use a python package for all the test results.
- In Machine Learning analytical solutions like that are called one-shot learning.
- How to flexibly think about regression and use it to test and find weights beyond factors
References
https://mba.tuck.dartmouth.edu/pages/faculty/ken.french/Data_Library/f-f_5_factors_2x3.html